Building a Trading Bot with Trality's Rule Builder (No Code!)

MORITZ PUTZHAMMER
07 July 2022 • 6 min read

Table of contents
In the following tutorial, we’ll introduce you to the basics of bot creation as well as take a deeper dive into fine tuning and backtesting your bot once it’s been created.
By the end of this guide, you’ll have created your very own crypto trading bot as well as learned a great deal about the best practices to use when creating a successful bot, giving you both the knowledge and confidence to profit in the crypto market.
The Trality Rule Builder makes it possible to create your own crypto trading bots without the need to code. Use the Rule Builder’s one-of-a-kind graphical user interface to build your trading bot’s logic by simply dragging and dropping indicators and strategies. The next step is backtesting, as it can help you understand performance and risk in different market conditions.
For demonstration purposes, we created a simple trend following strategy on a single currency pair, namely BTC/USDT. In our step-by-step tutorial, our trading bot generated 128.36% return, which we backtested against different scenarios before finally optimizing it to improve the return to 139.11%.
Create a new bot
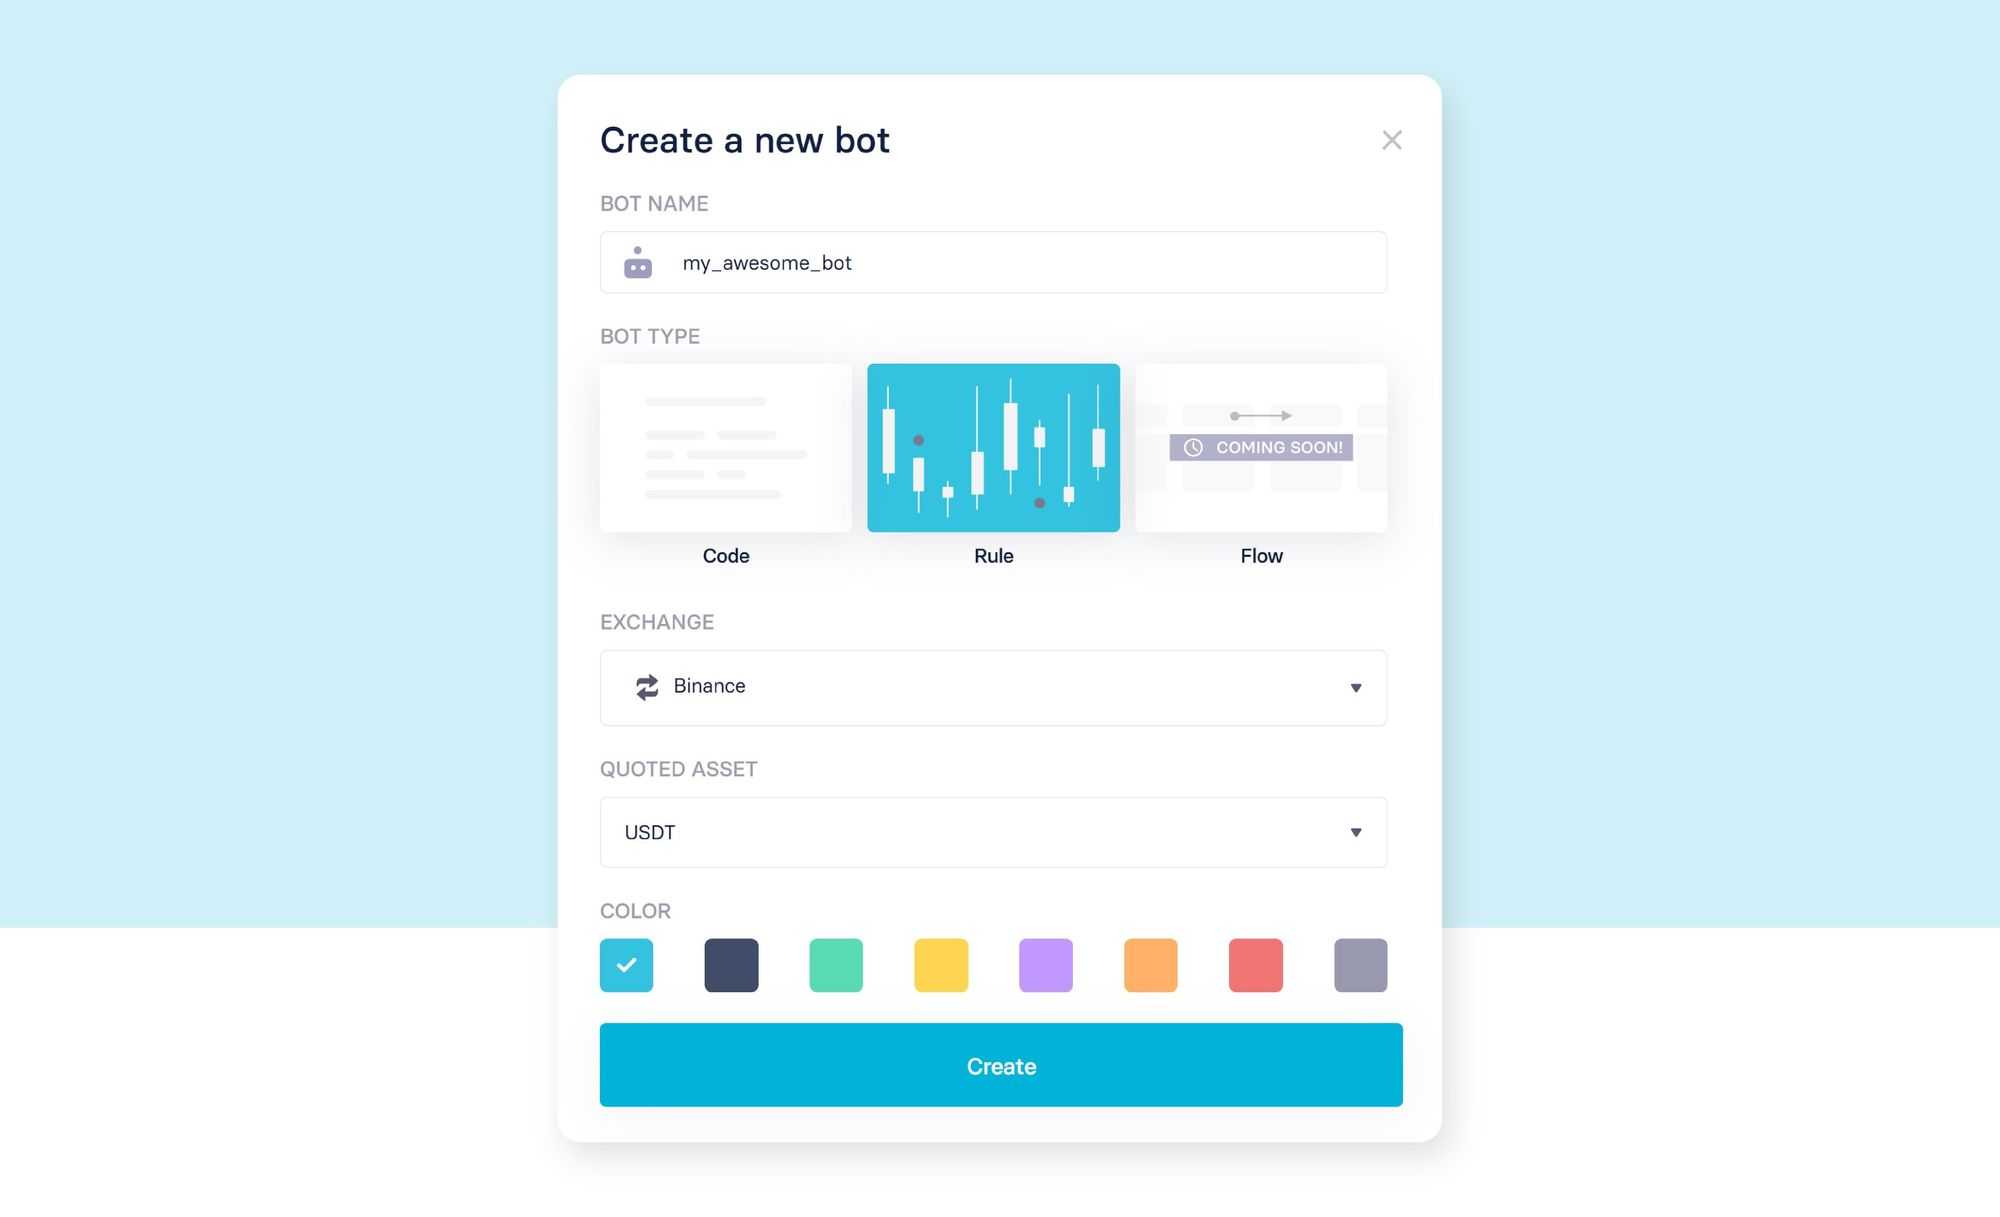
Let's get started! To create a bot with our Rule Builder, we simply name our bot and select "Rule" as bot type. We then choose an exchange to trade on, as well as a quoted asset for our algorithm. The quoted asset represents the currency that all trades are being executed against.
Choose your Assets
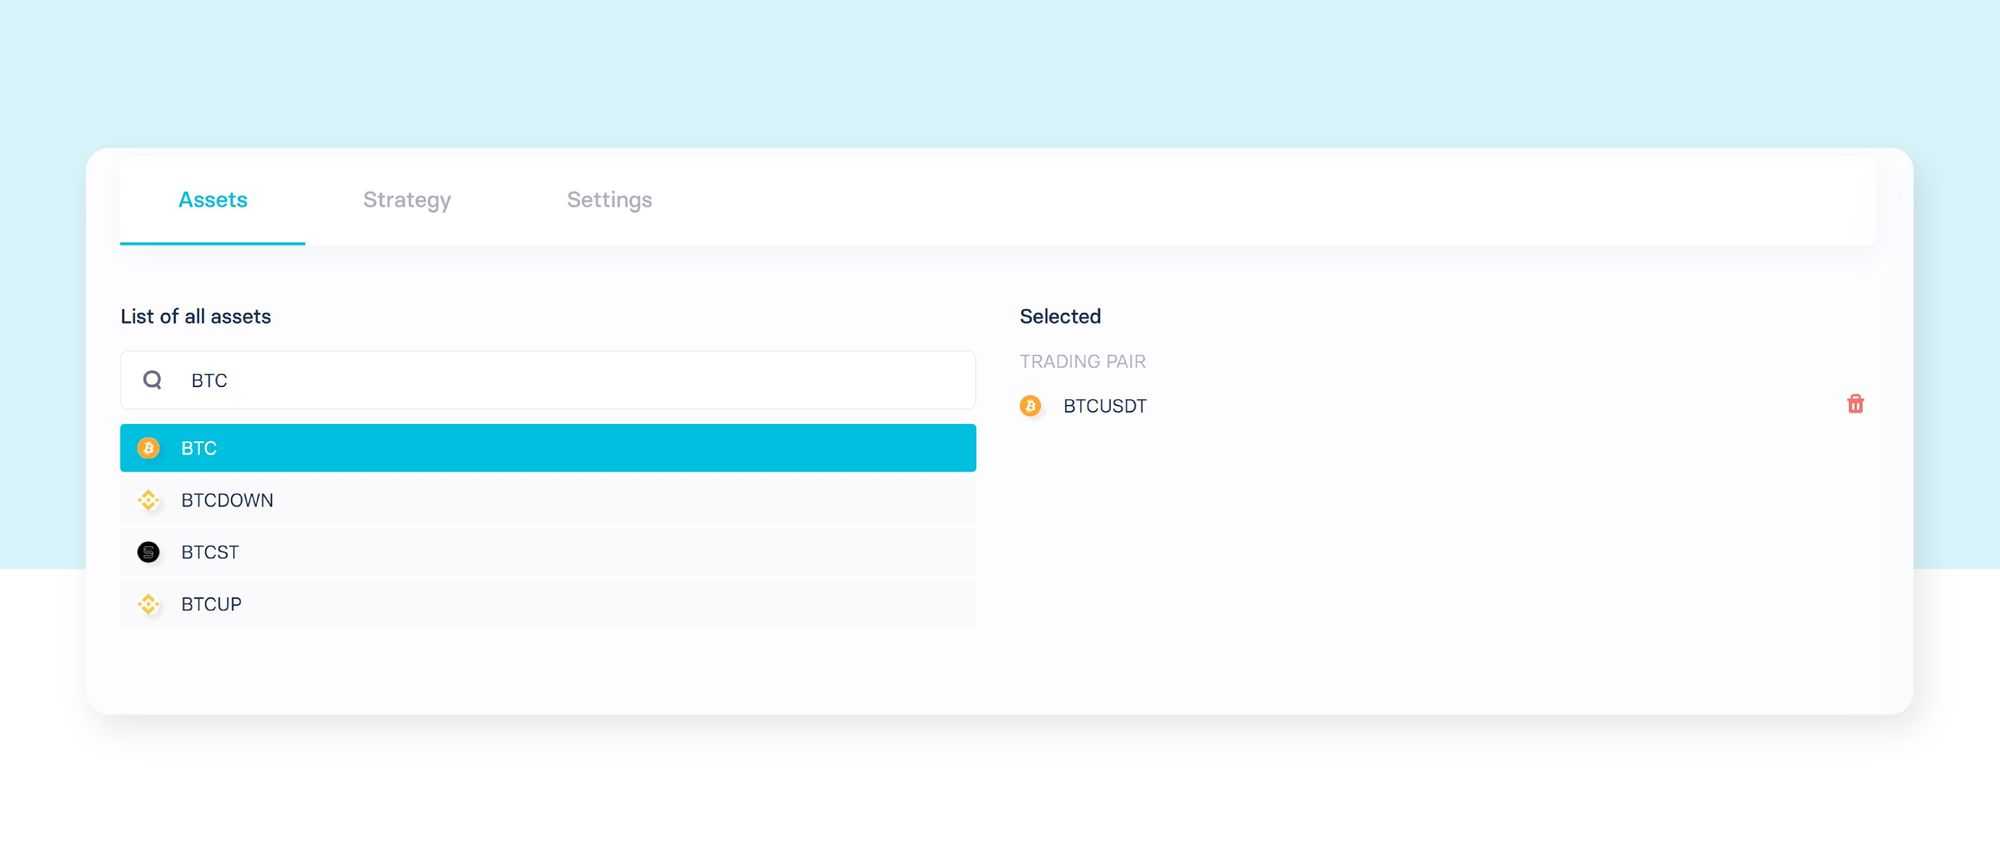
Now we choose the trading pairs we want our bot to trade on, i.e. which coins should be bought and sold with our quoted asset. For our exemplary trading bot, we will simply select BTC, hence our bot will trade on the symbol BTC/USDT.
Add your General Settings
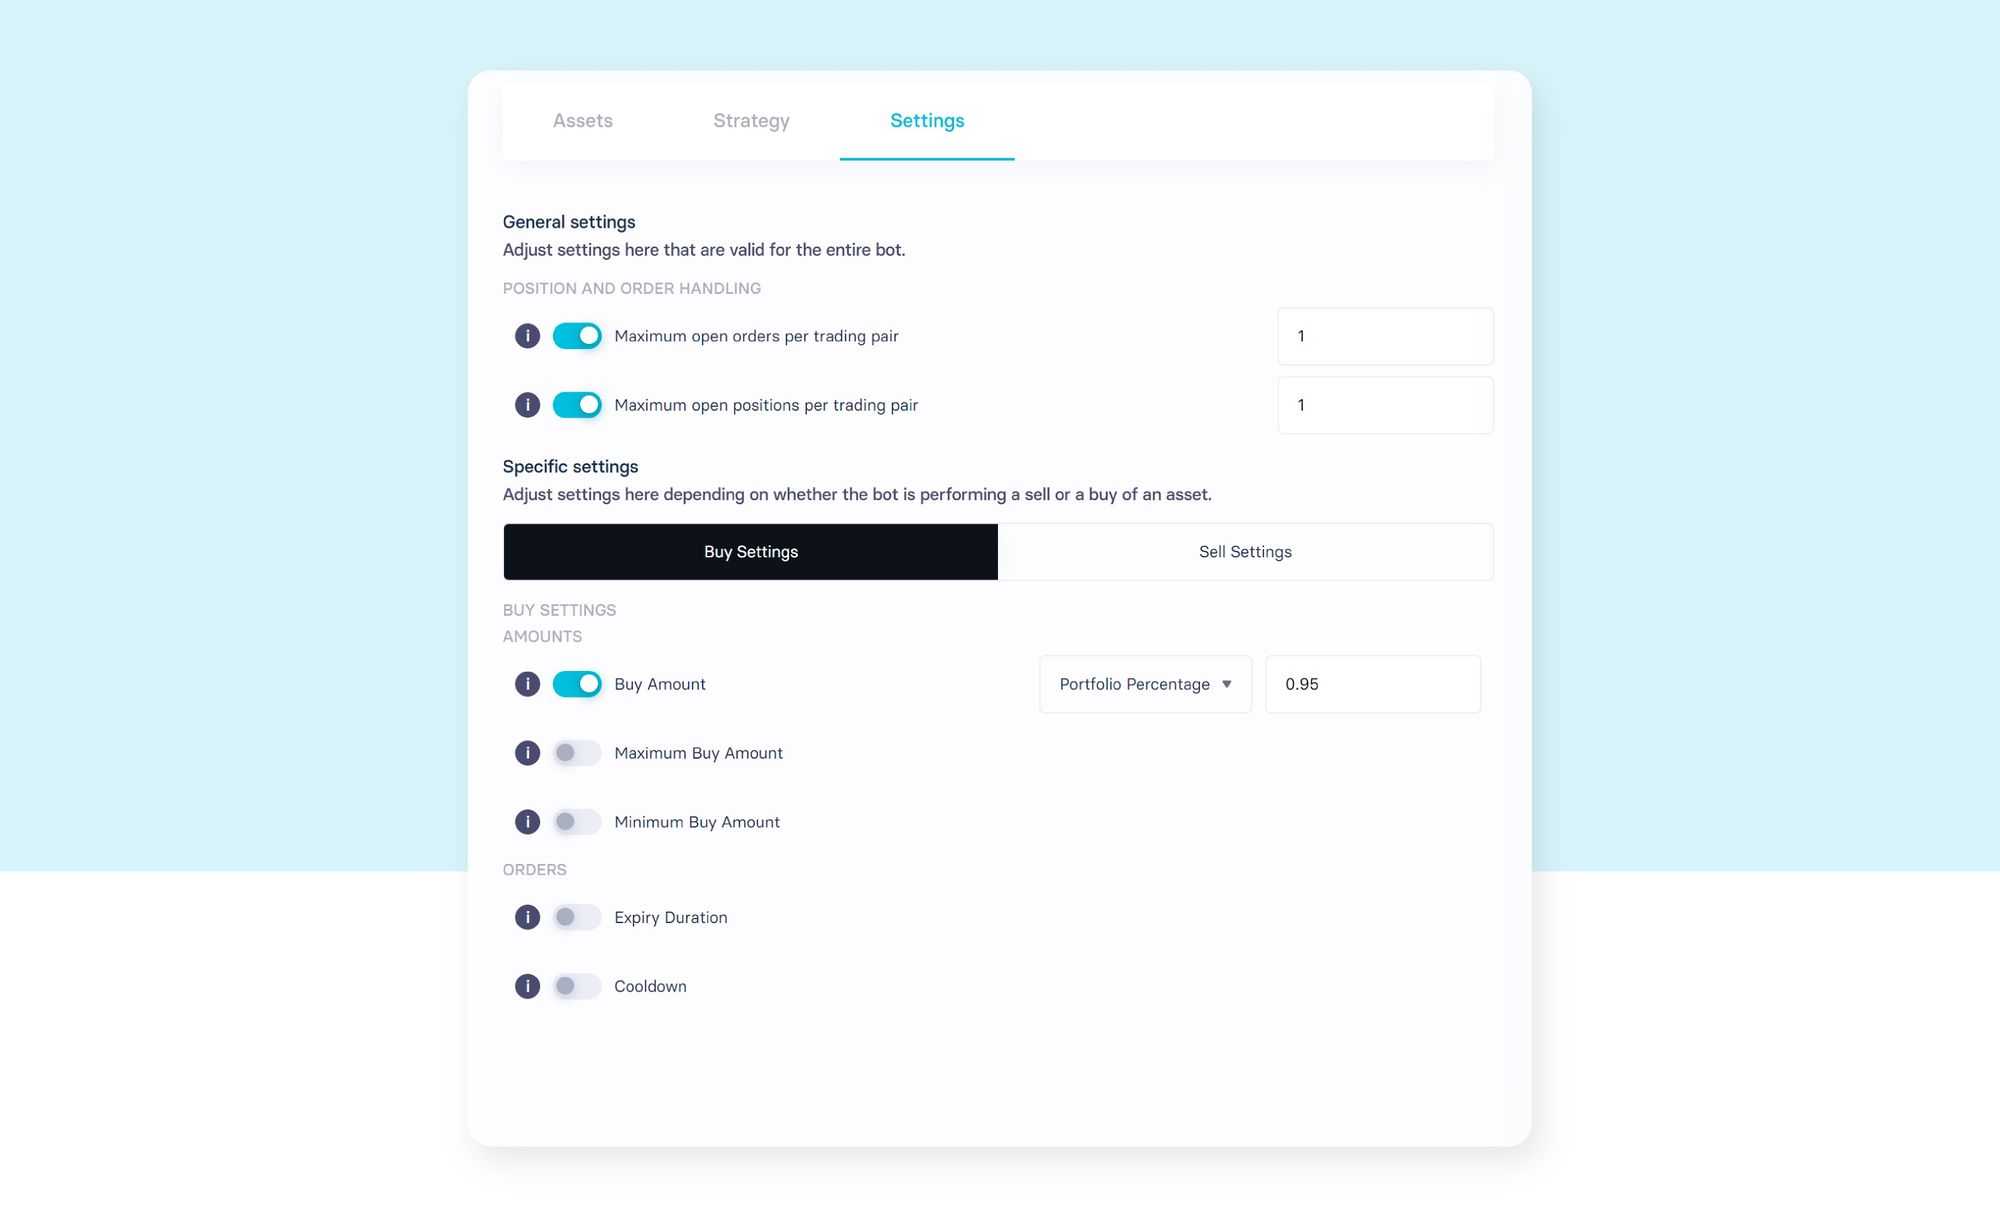
Before we actually start to define the actual strategy of our bot, we want to define general settings for it. For a detailed description of all settings, head over to the Trality Docs and check out the Rule Builder section.
For now we just set the "Buy amount" to 0.95 which means 95% of the portfolio value. Meaning we will, at any given time, hold 5% of our quoted asset.
Define your Strategy
Strategy design is at the core of every trading bot, which means that now is the time to specify the actual trading signals. More precisely, your strategy is comprised of various predefined strategies that will generate buy or sell signals.
Our goal is to define a simple trend following strategy that tries to identify entry points to buy BTC when an upward trend is detected and sell BTC when a reverse trend is happening. A popular choice for such signals is the crossover of moving averages.
To add our BUY signal, we go to the strategy tab and press the "Add new" button. In the pop up menu we select "MA-Crossover" then choose "BUY" and tick the expert box to adjust the details of this predefined strategy.
To add our SELL signal, click the "Add new" button again, select "MA-Crossover" then choose "SELL" and tick the expert box and use the same details as the BUY signal.
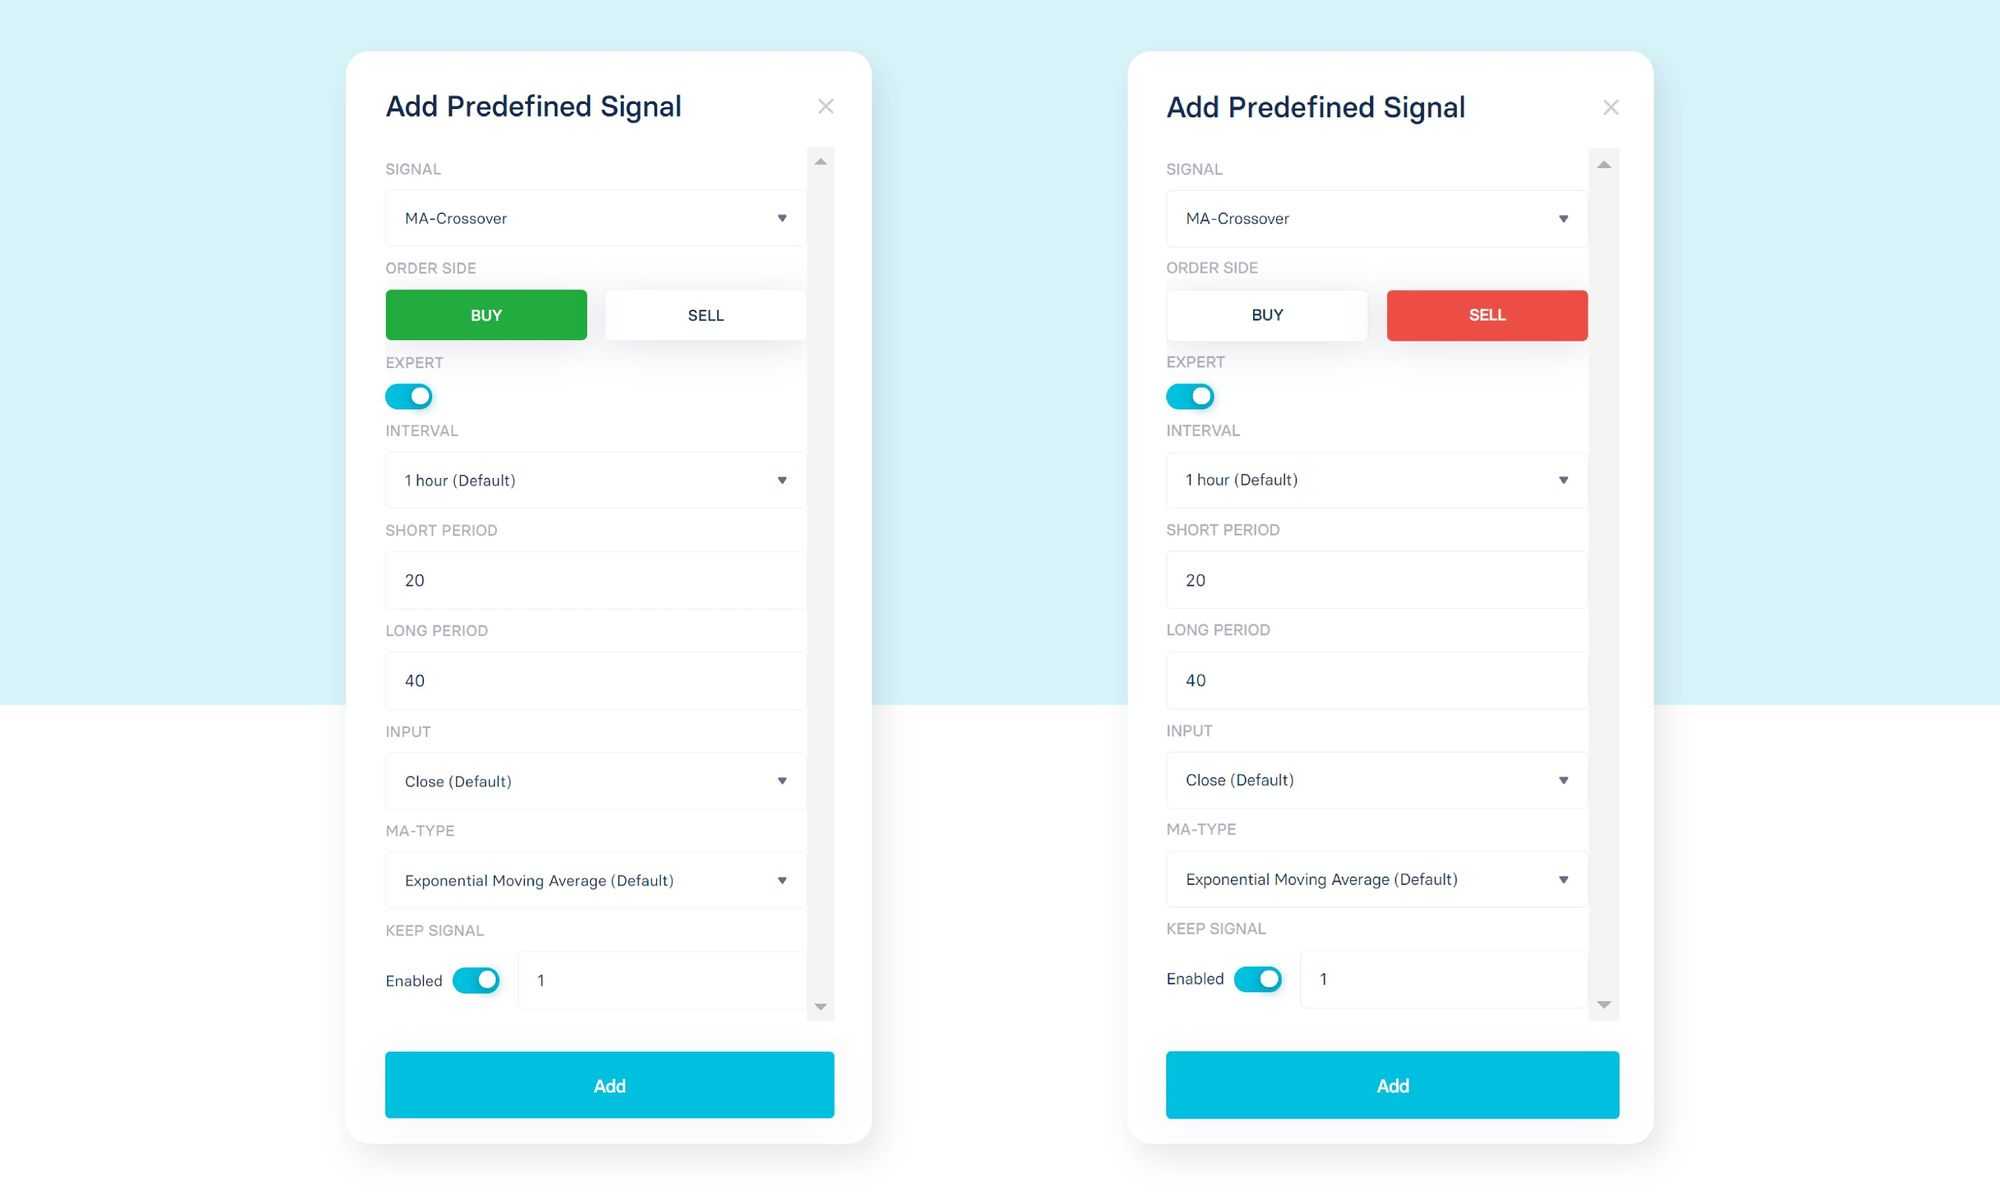
It is important to note, that specifying the buy or sell signal will automatically resolve the direction for the signal, or technically the combination of indicators. This means MA-Crossover BUY generates a buy order whenever the shorter EMA(20) crosses the longer EMA(40) from below. Equally, MA-Crossover SELL sends a sell order when the long EMA(40) crosses the EMA(20) from above.
We select the MA-Crossover on an hourly interval with EMA(20) and EMA(40) for both buy and sell types. The strategy overview shows our strategies with the signals they trigger, their names and intervals they run on. As a result we obtain the following preliminary strategy:

Backtest your Strategy
A backtest is a historical simulation of your trading strategy. It can help you understand performance and risk in different market conditions.
For our purpose we will test our bot on different timeframes and various scenarios, to find potential drawbacks of our algorithm. As a start we simply backtest our bot for 12 months (23.05.2019 - 17.05.2020). The backtest result of our strategy can be found below:
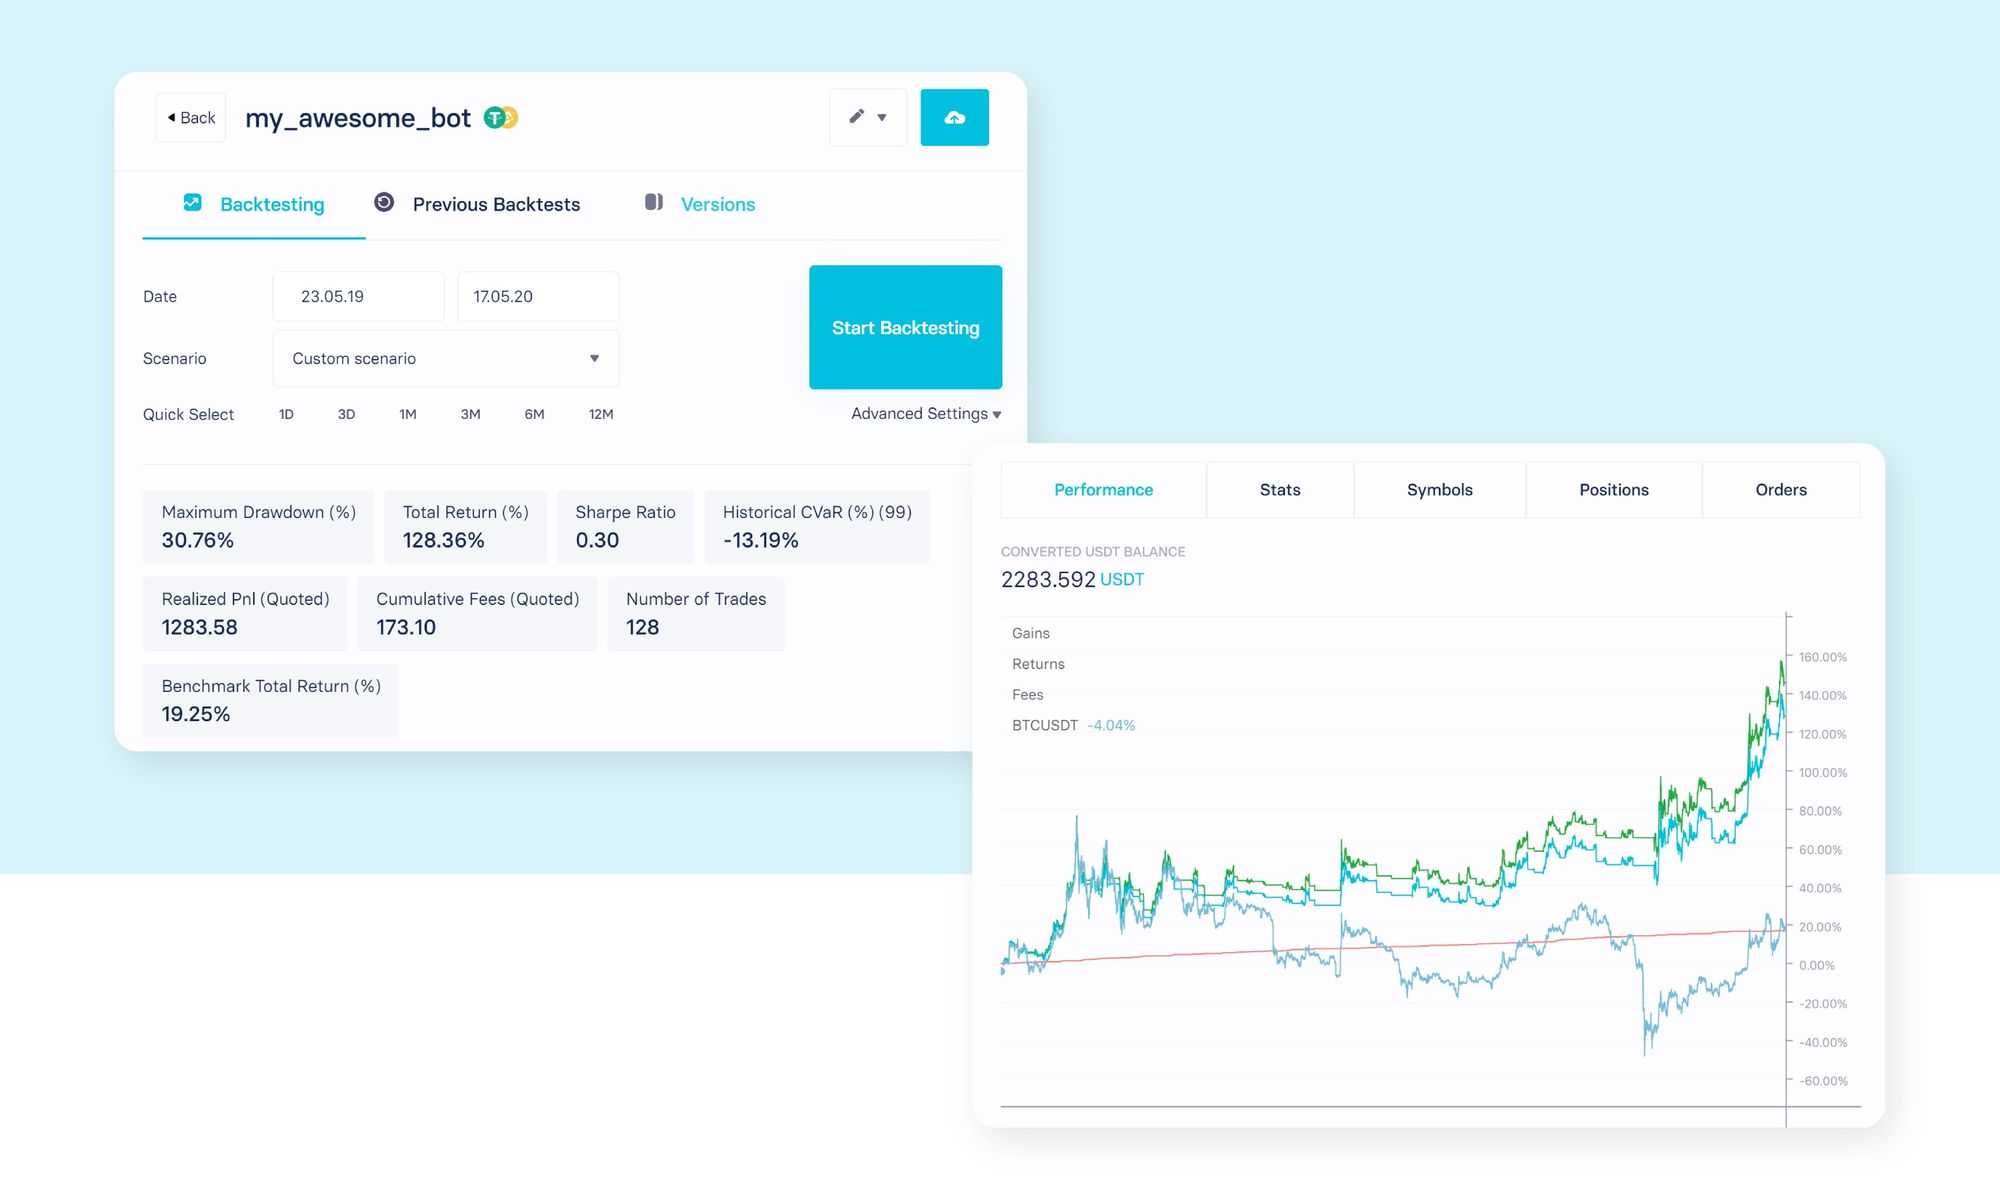
It seems that trends are identified really well by our trading bot. It outperforms a simple buy and hold strategy by far.
Now let's look at a more difficult time period, the first quarter of 2019 (01.01.2019 - 01.04.19), which is characterized by wild swings and massive price jumps in BTC/USDT. We run the backtest and check the results:
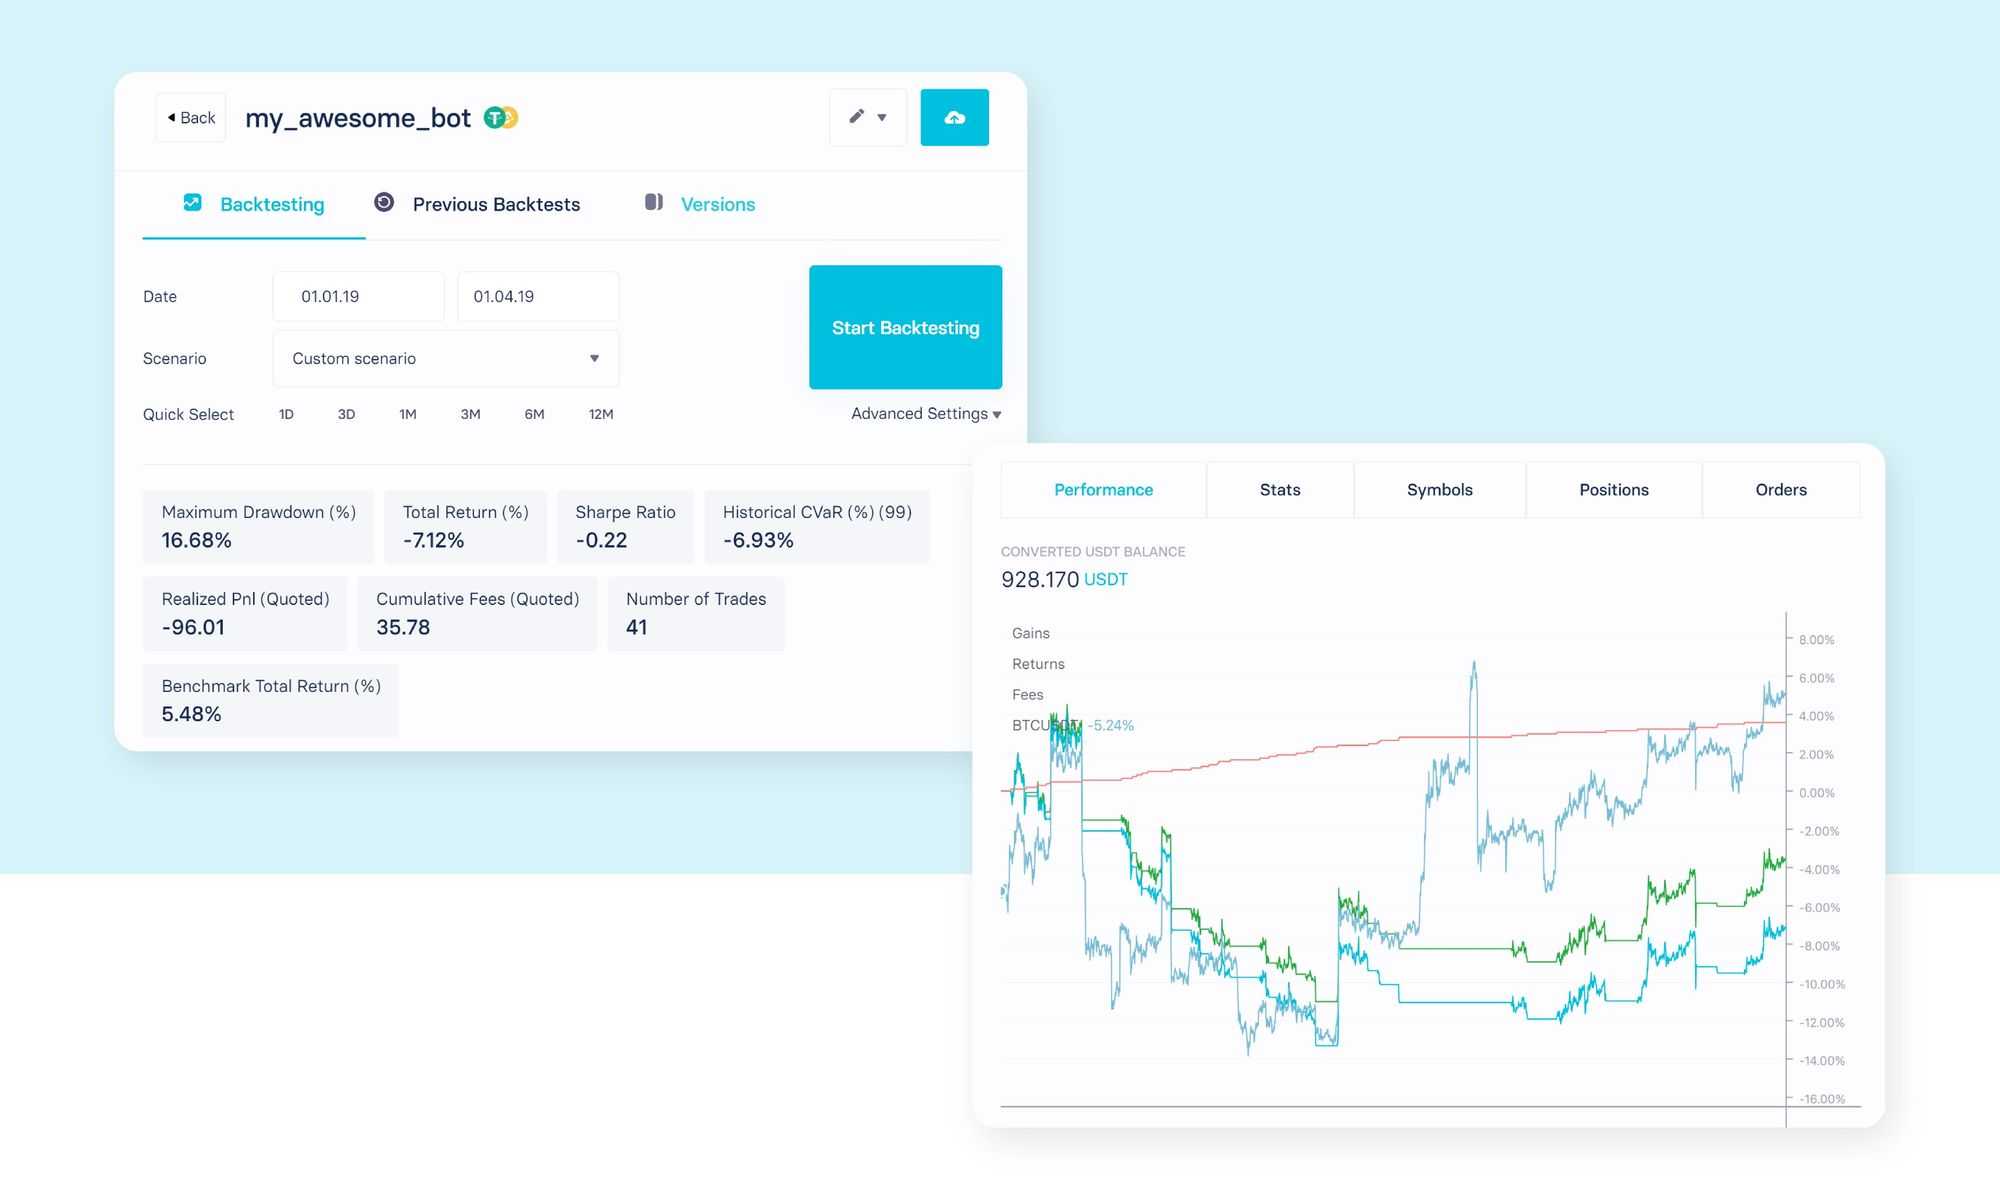
As we can see, while the Benchmark Total Return is positive (5.48%), our Total Return is negative (-7.12%). During the fast price swings in this time period, our EMA cross sell signal tends to lag behind and we exit trades when momentum is already lost.
In the next step we refine our strategy and try to address the problems mentioned above.
Refine your Strategy
Early exit with RSI
In this section, we try to find a way how to exit the market earlier to avoid the above-mentioned problem. In order to do so, we can look at the RSI strategy, which relates the average up move to the average down move on a given time horizon. As a result, this signal can be used to measure the strength of an up versus down move. We add the RSI sell signal as follows:
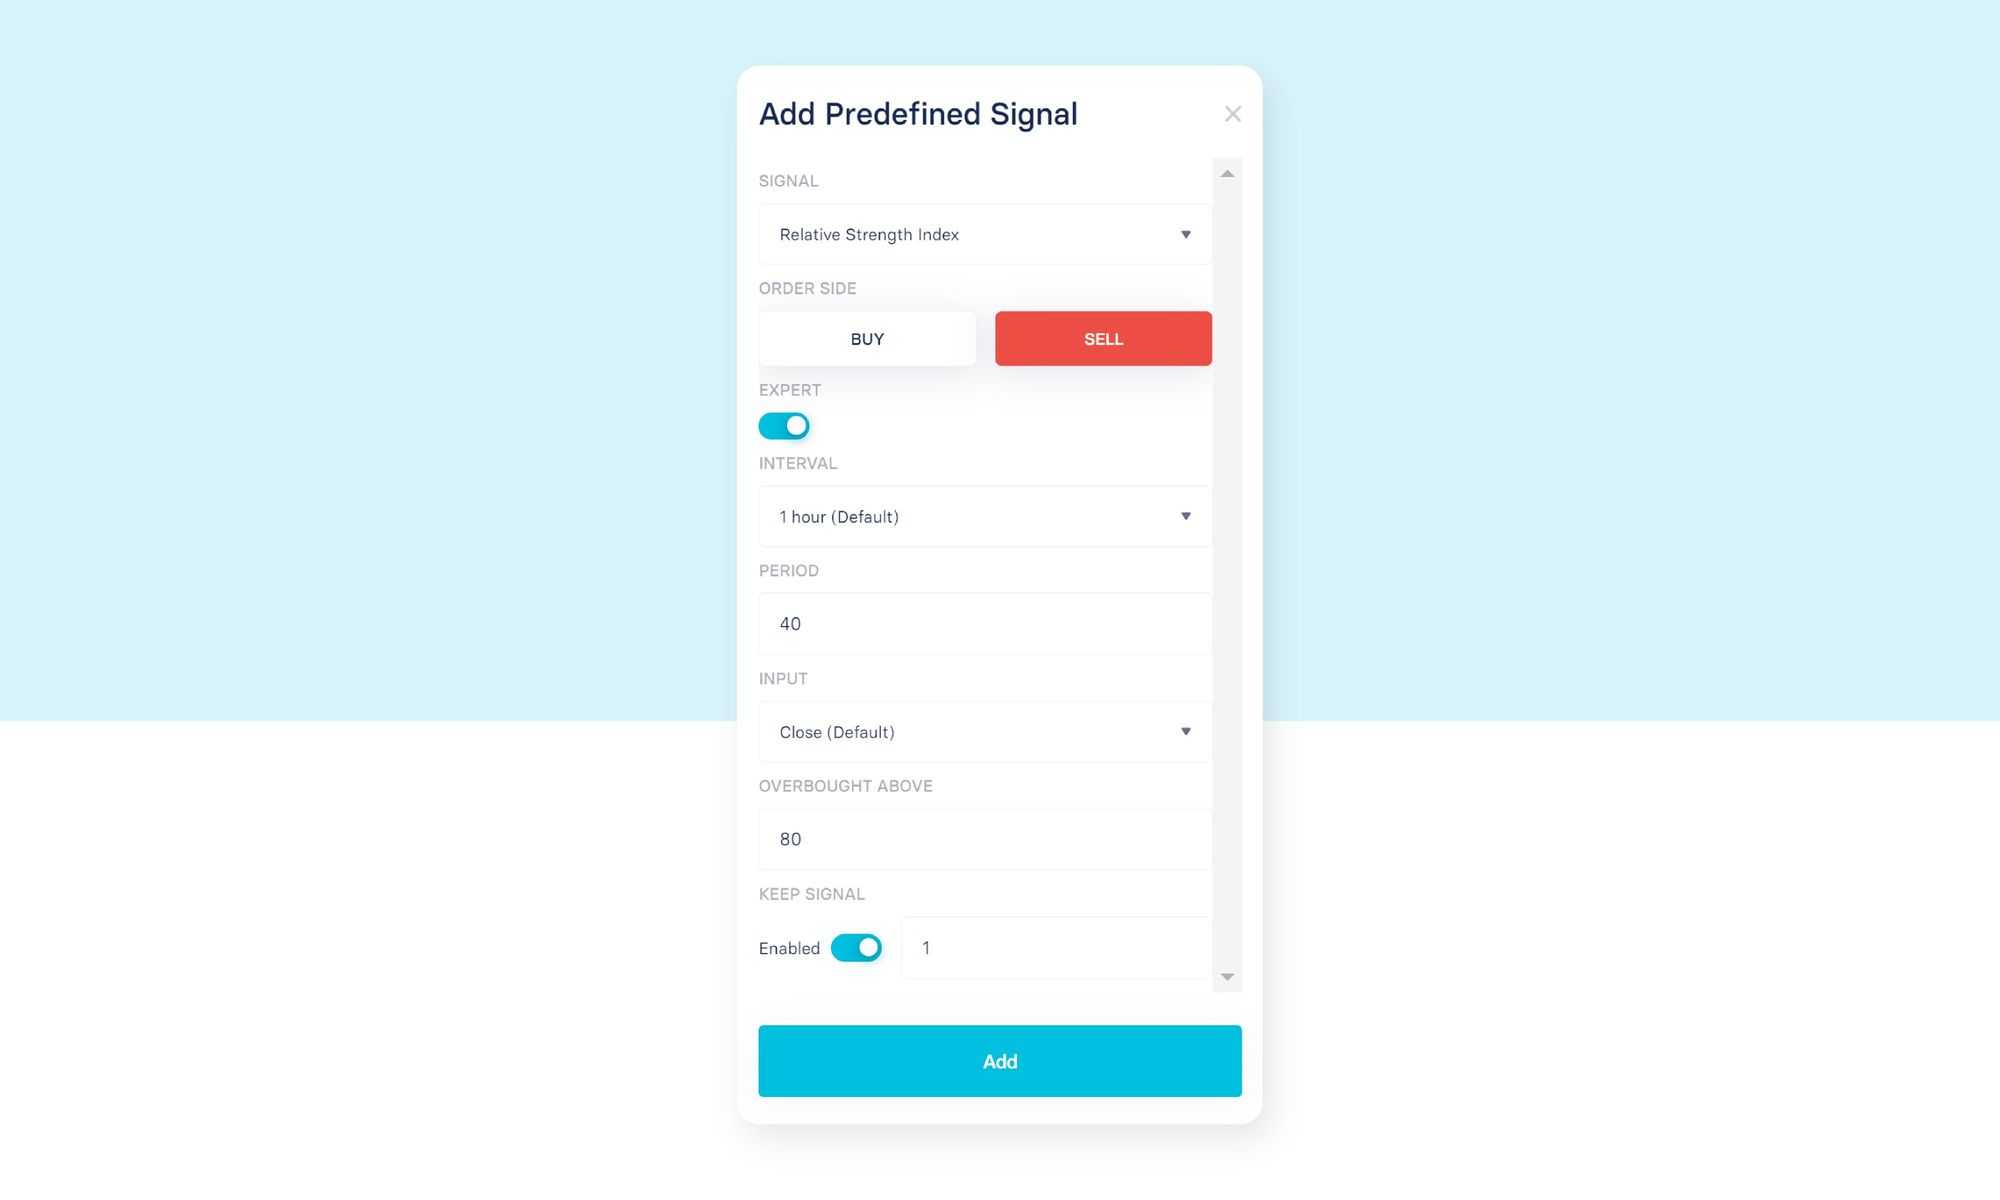
Now we combine the two sell signals with Boolean logic by simply mouse-dragging one over the other. The resulting strategy then looks as follows:
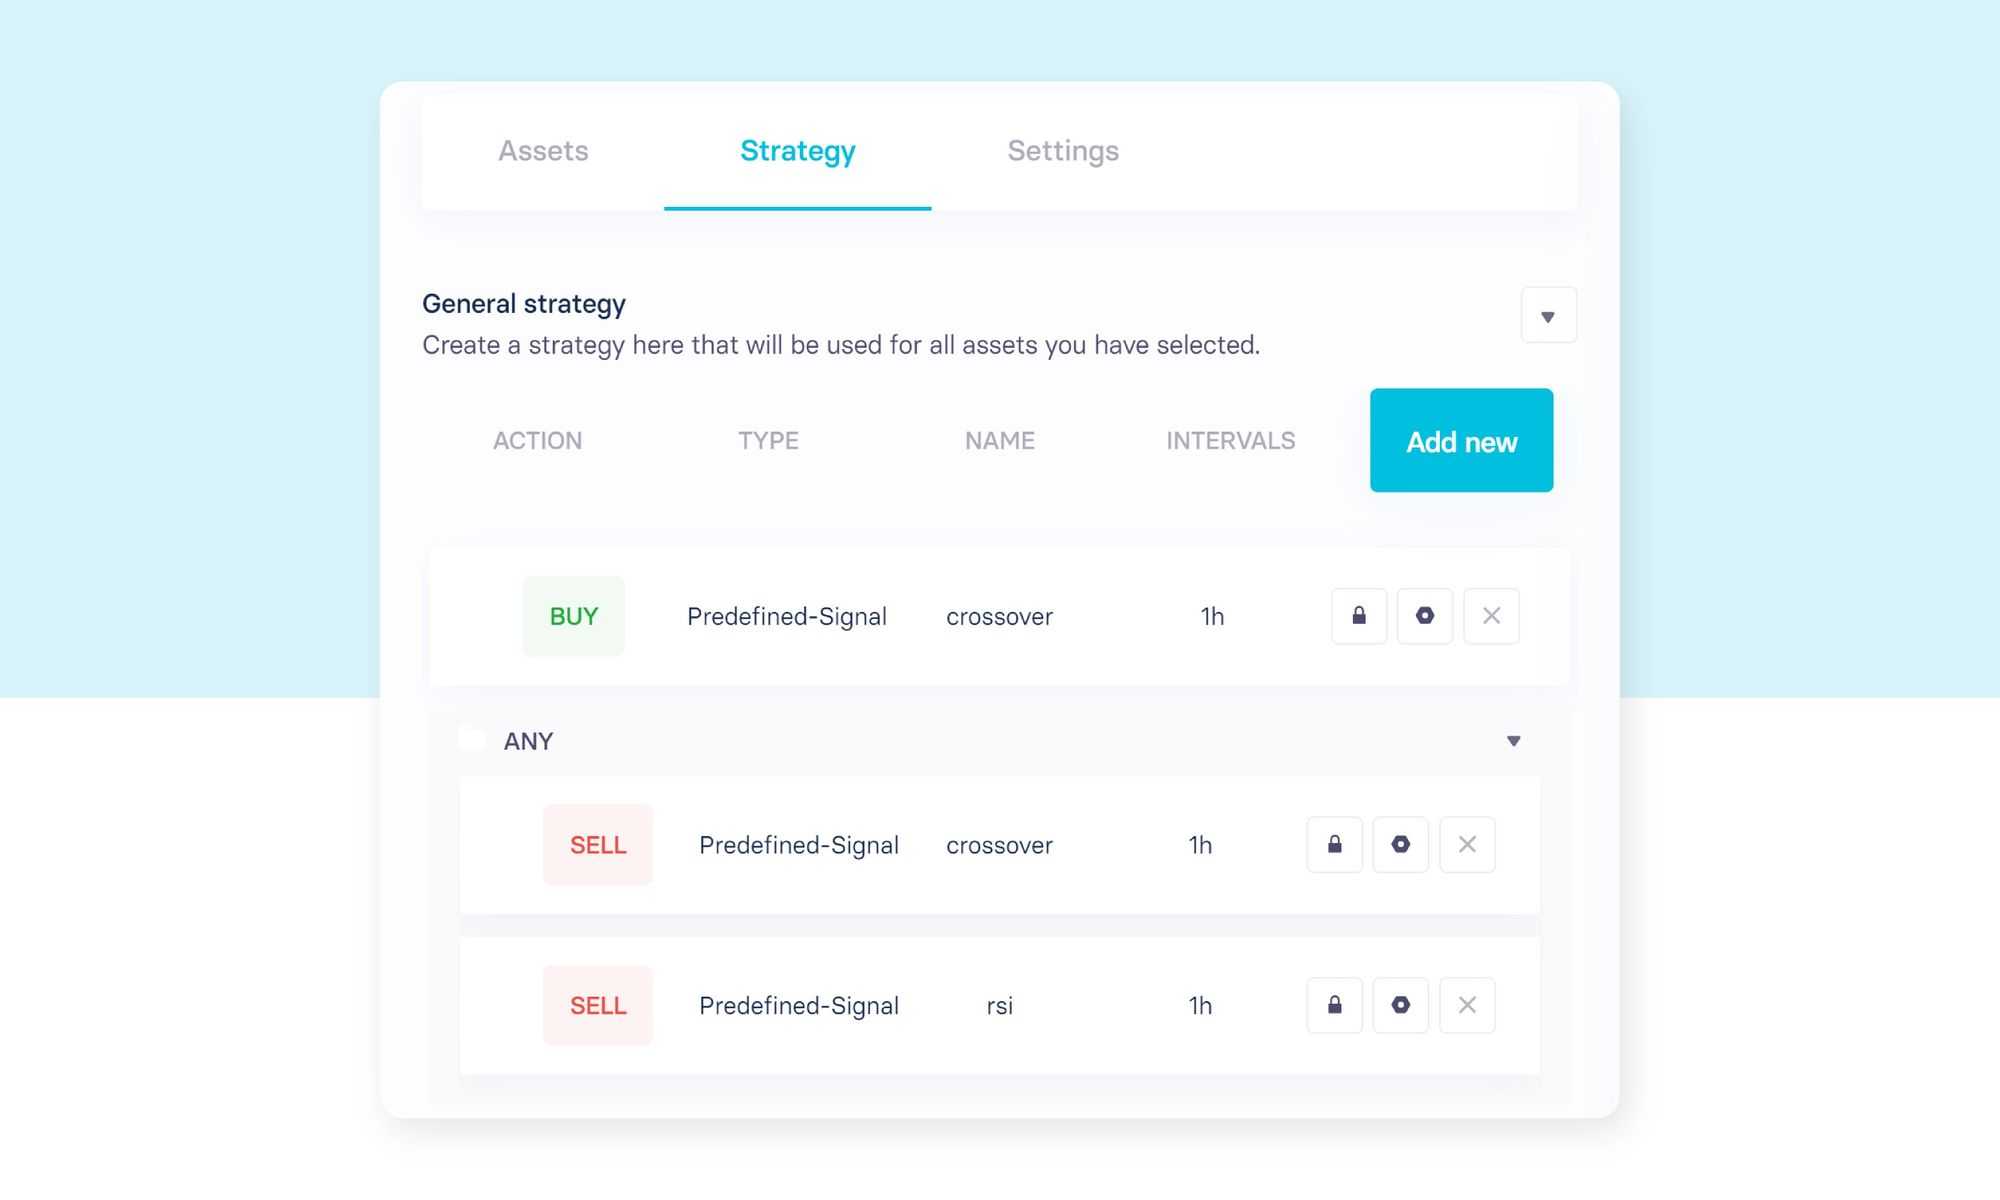
Rerunning our refined strategy for the same 12 month period shows performance improvements.
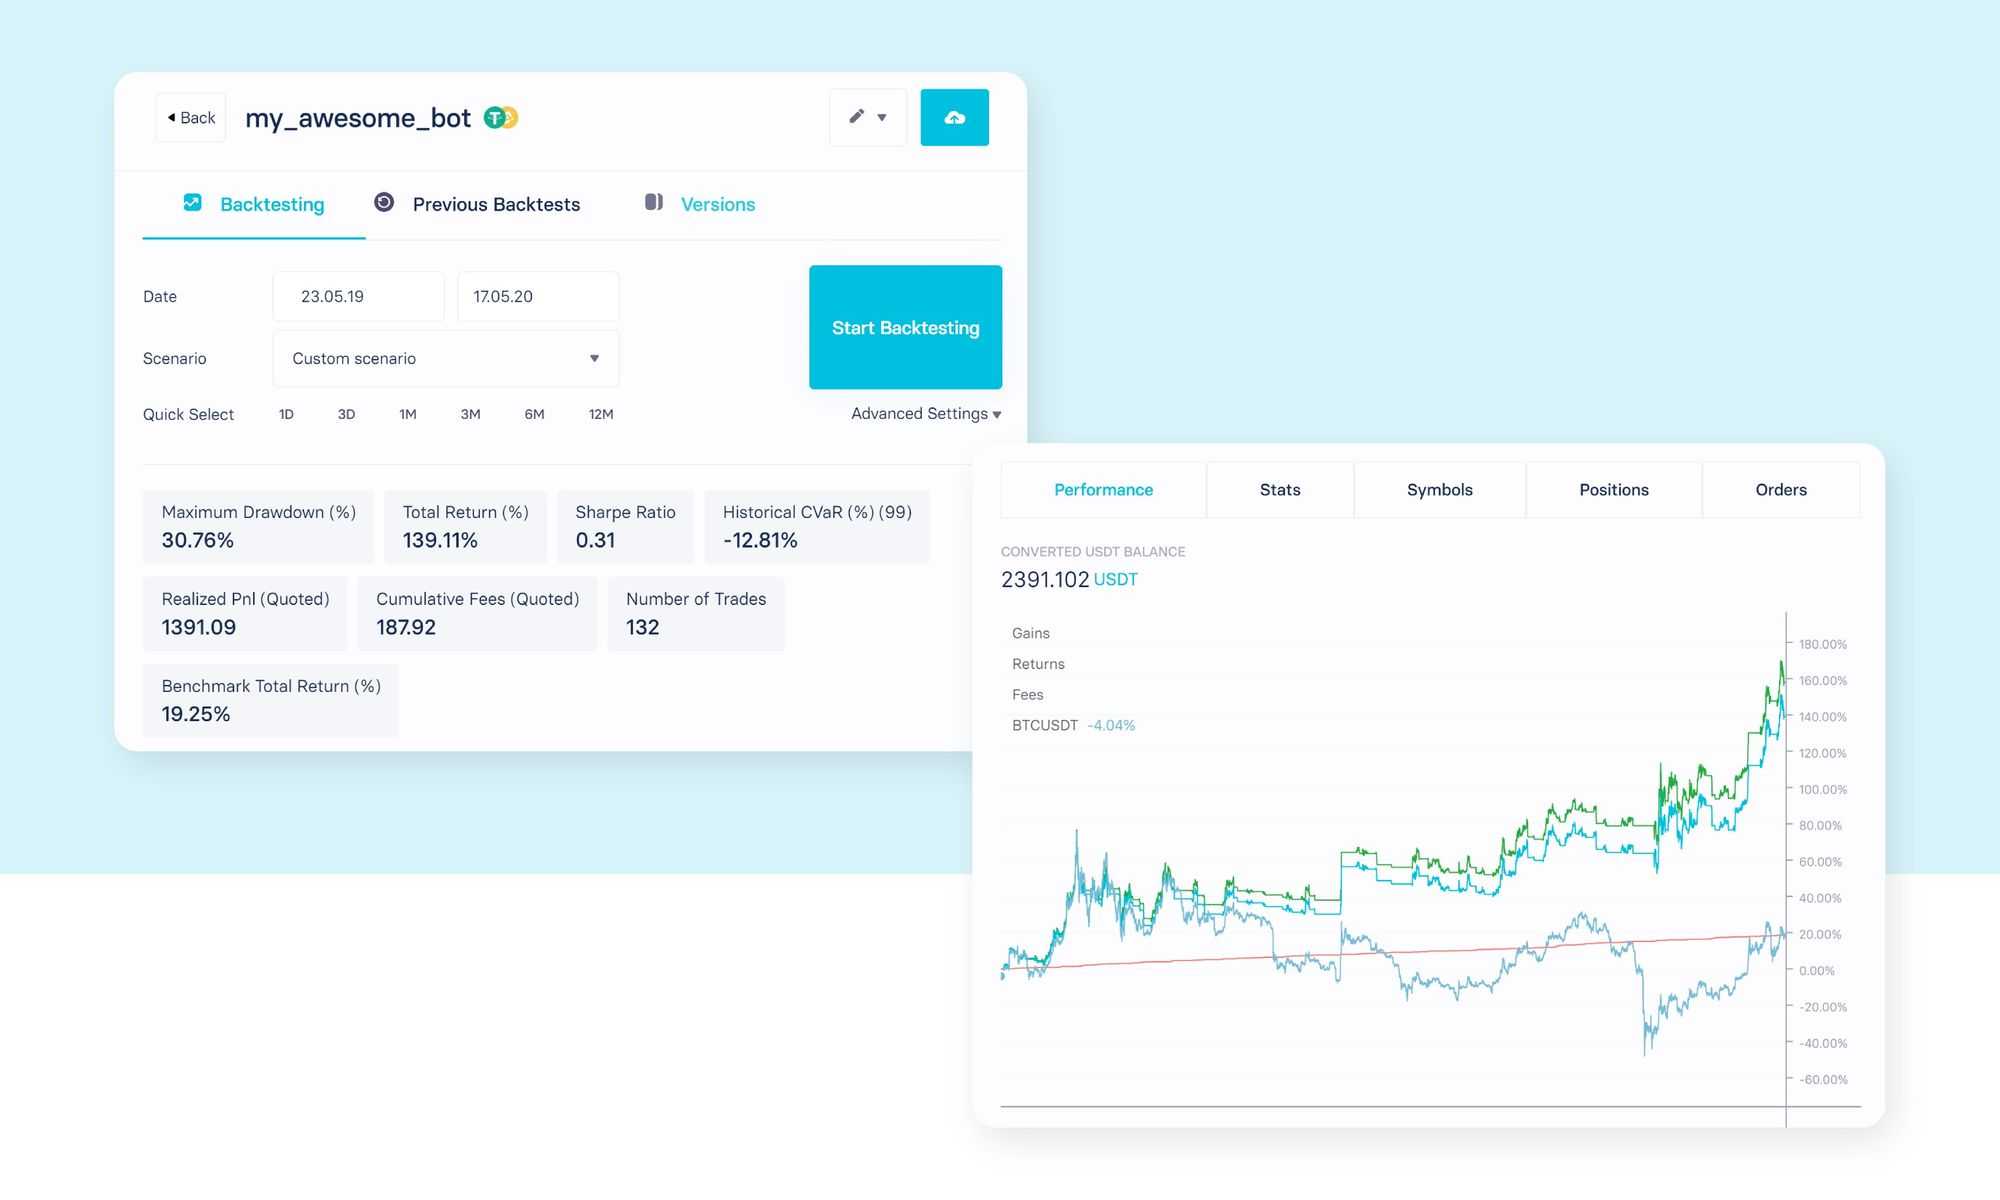
It seems reasonable to combine trend direction (MA-Crossover) with an additional exit signal such as RSI that measures strength of movement.
In conclusion, we see that testing on different time frames as well as choosing different starting points is critical to understanding bot performance.
Research, Improve and Go Live
We hope that our illustrations have convinced you how easily your investment ideas can be transformed into tradable strategies on Trality, which can then be modified, configured and tested in an intuitive way. Once confident with your strategy creation, deploying a trading bot for live trading is just as simple.
Ready to create your own trading bot with Trality? Try it for free!


